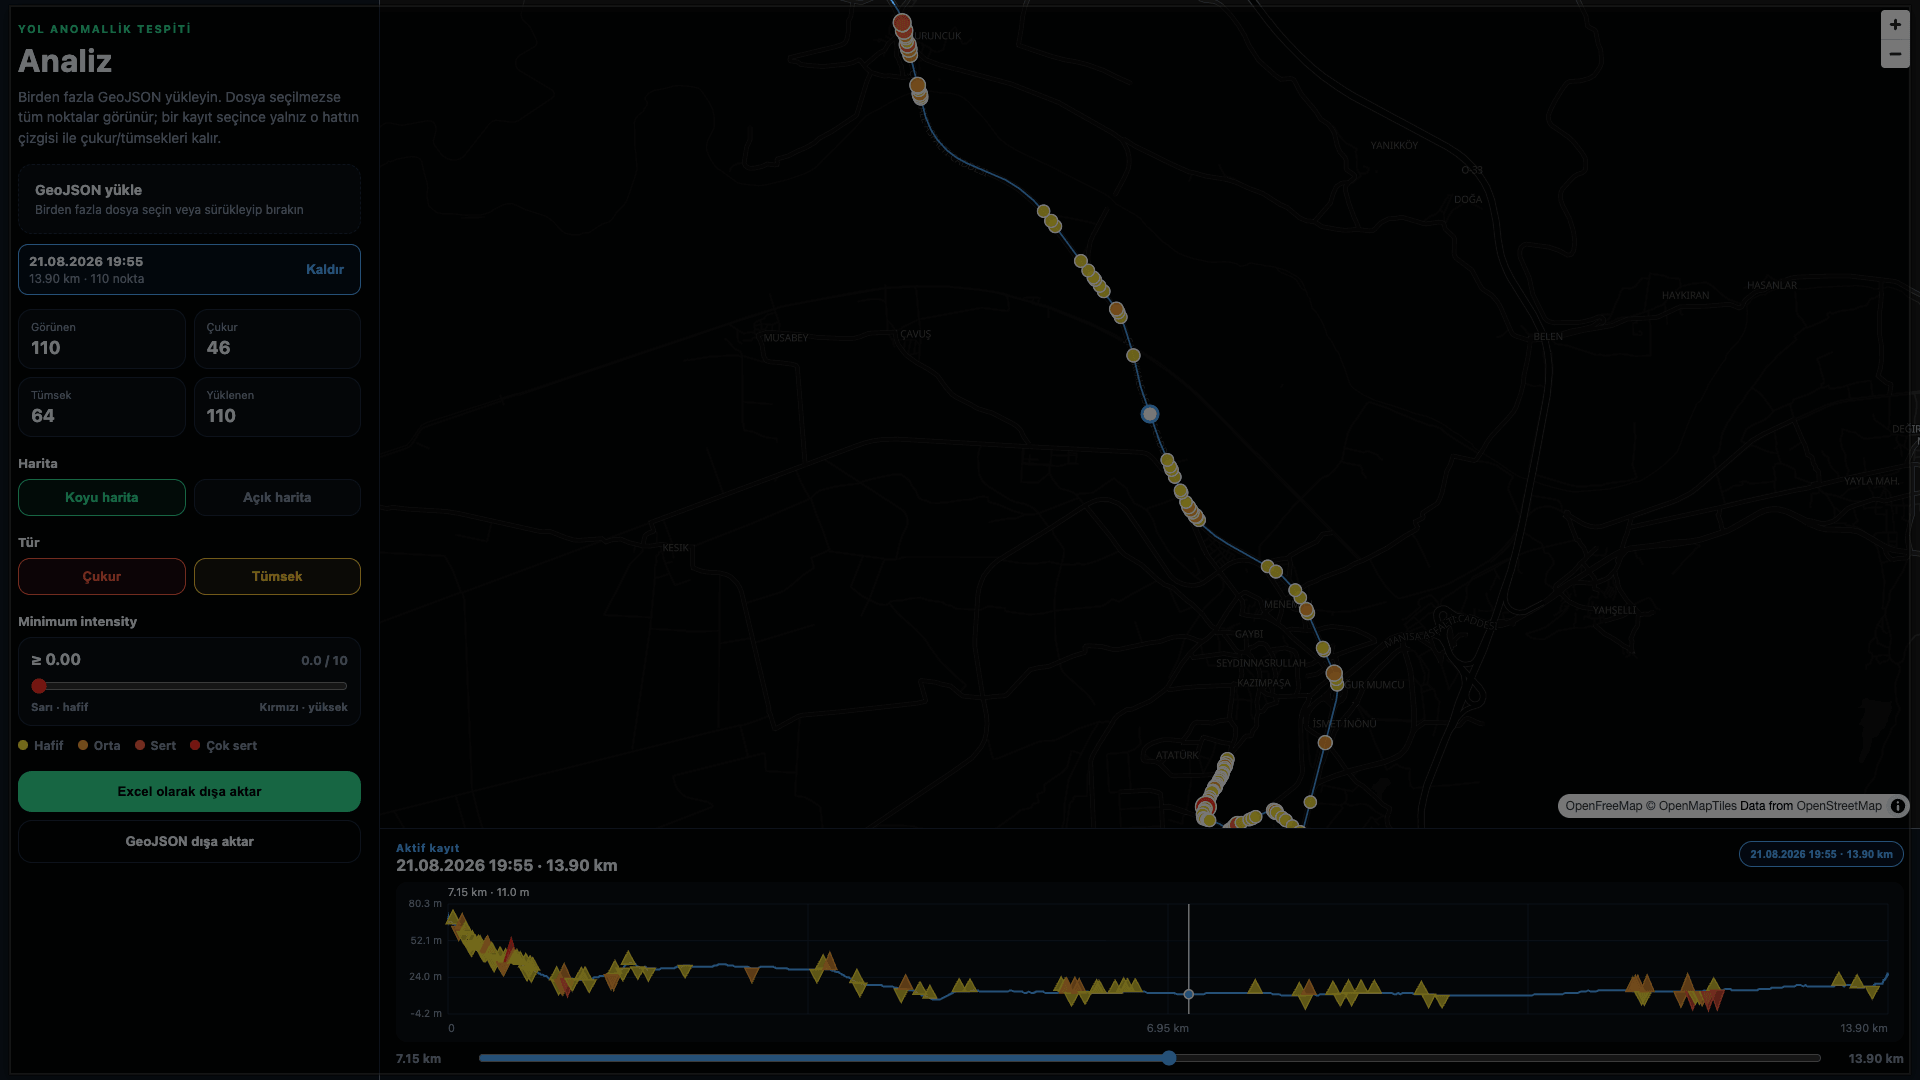
 Çukur mobile recording and vibration-trace interface
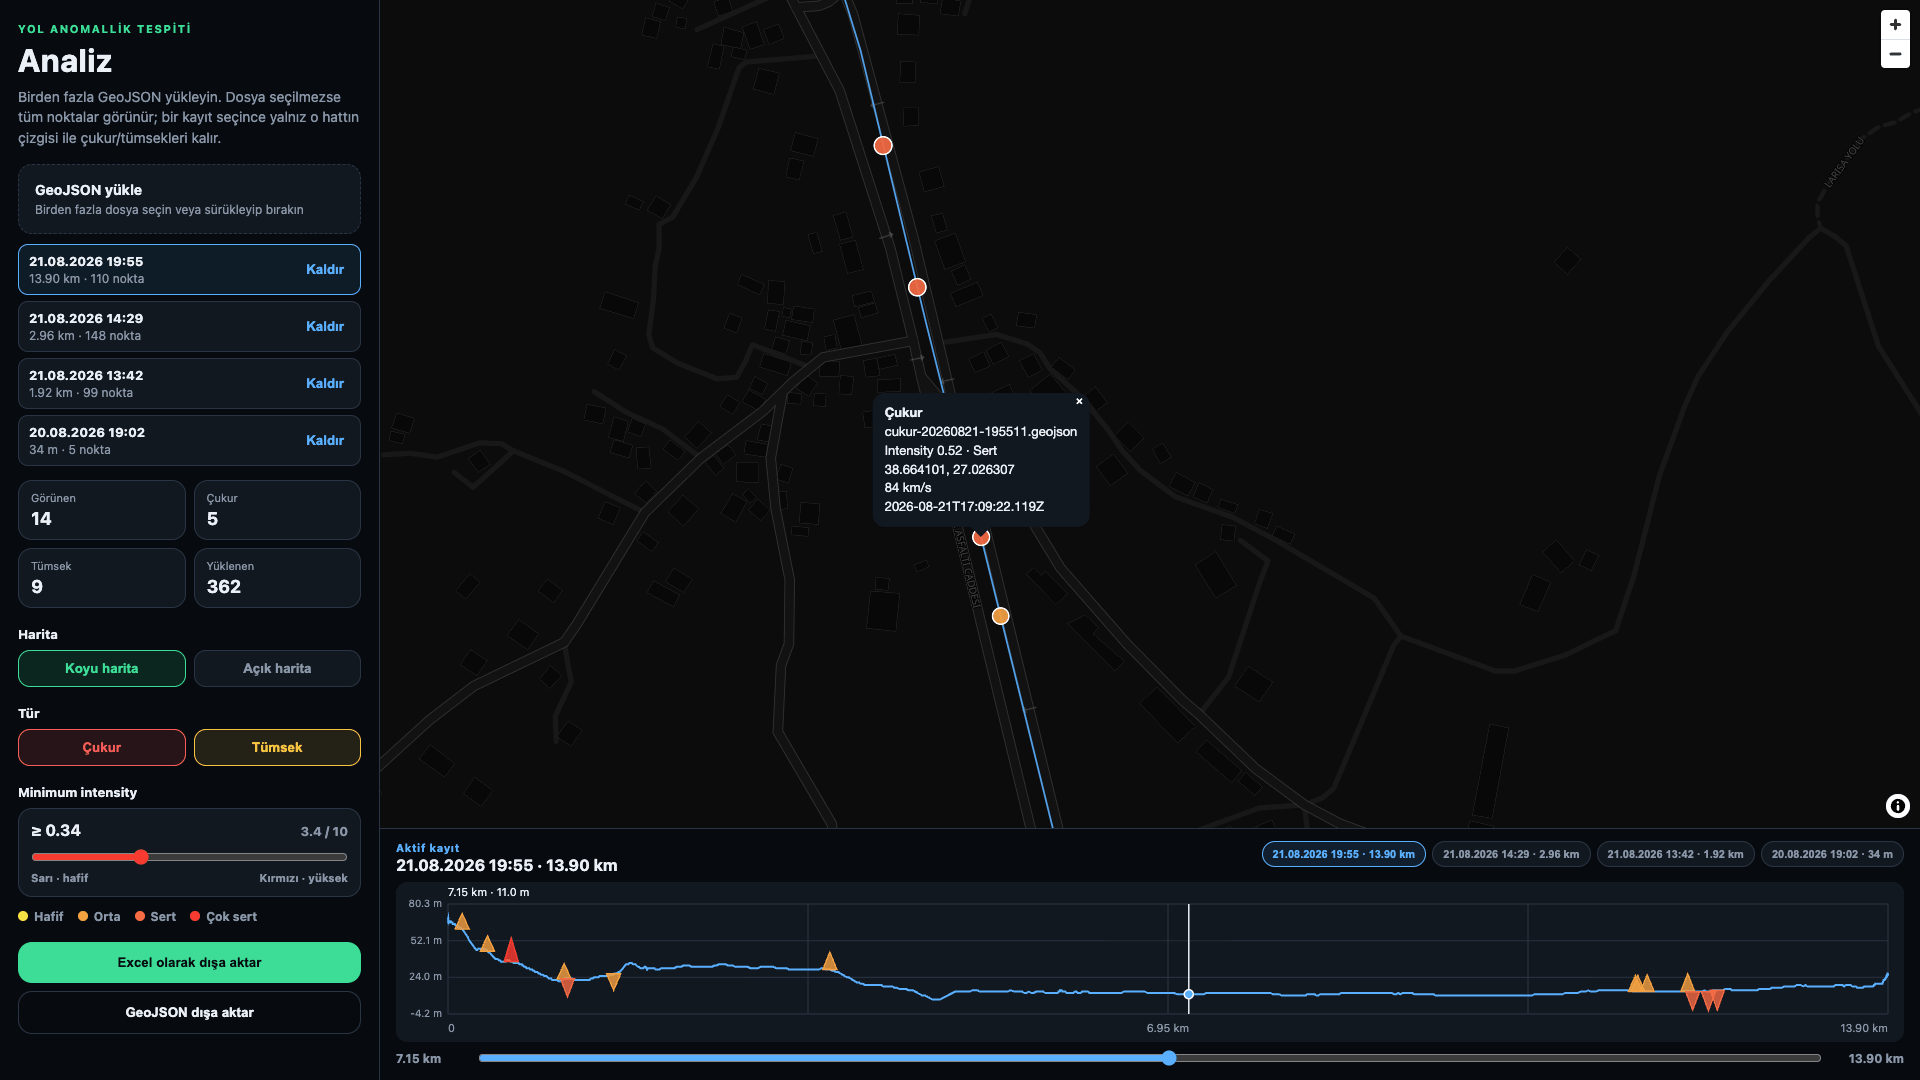 Multiple workspaces displayed together
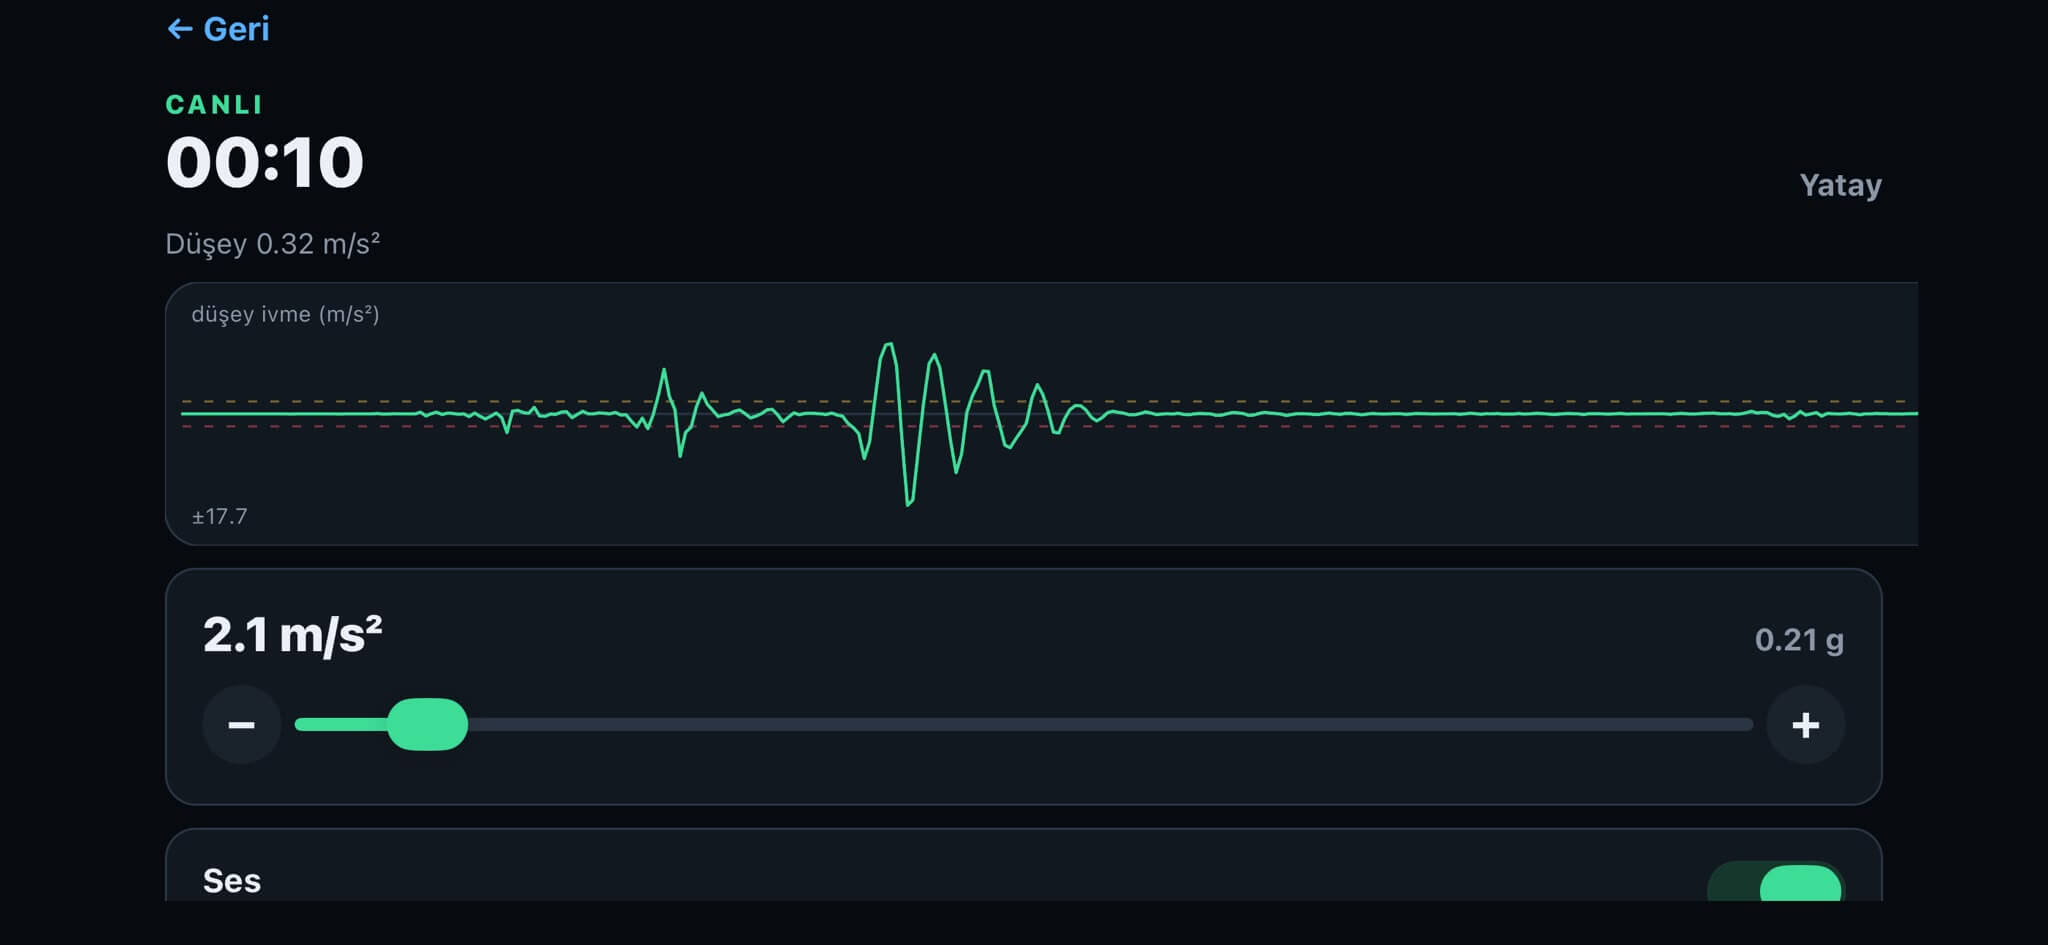 Mobile recording application
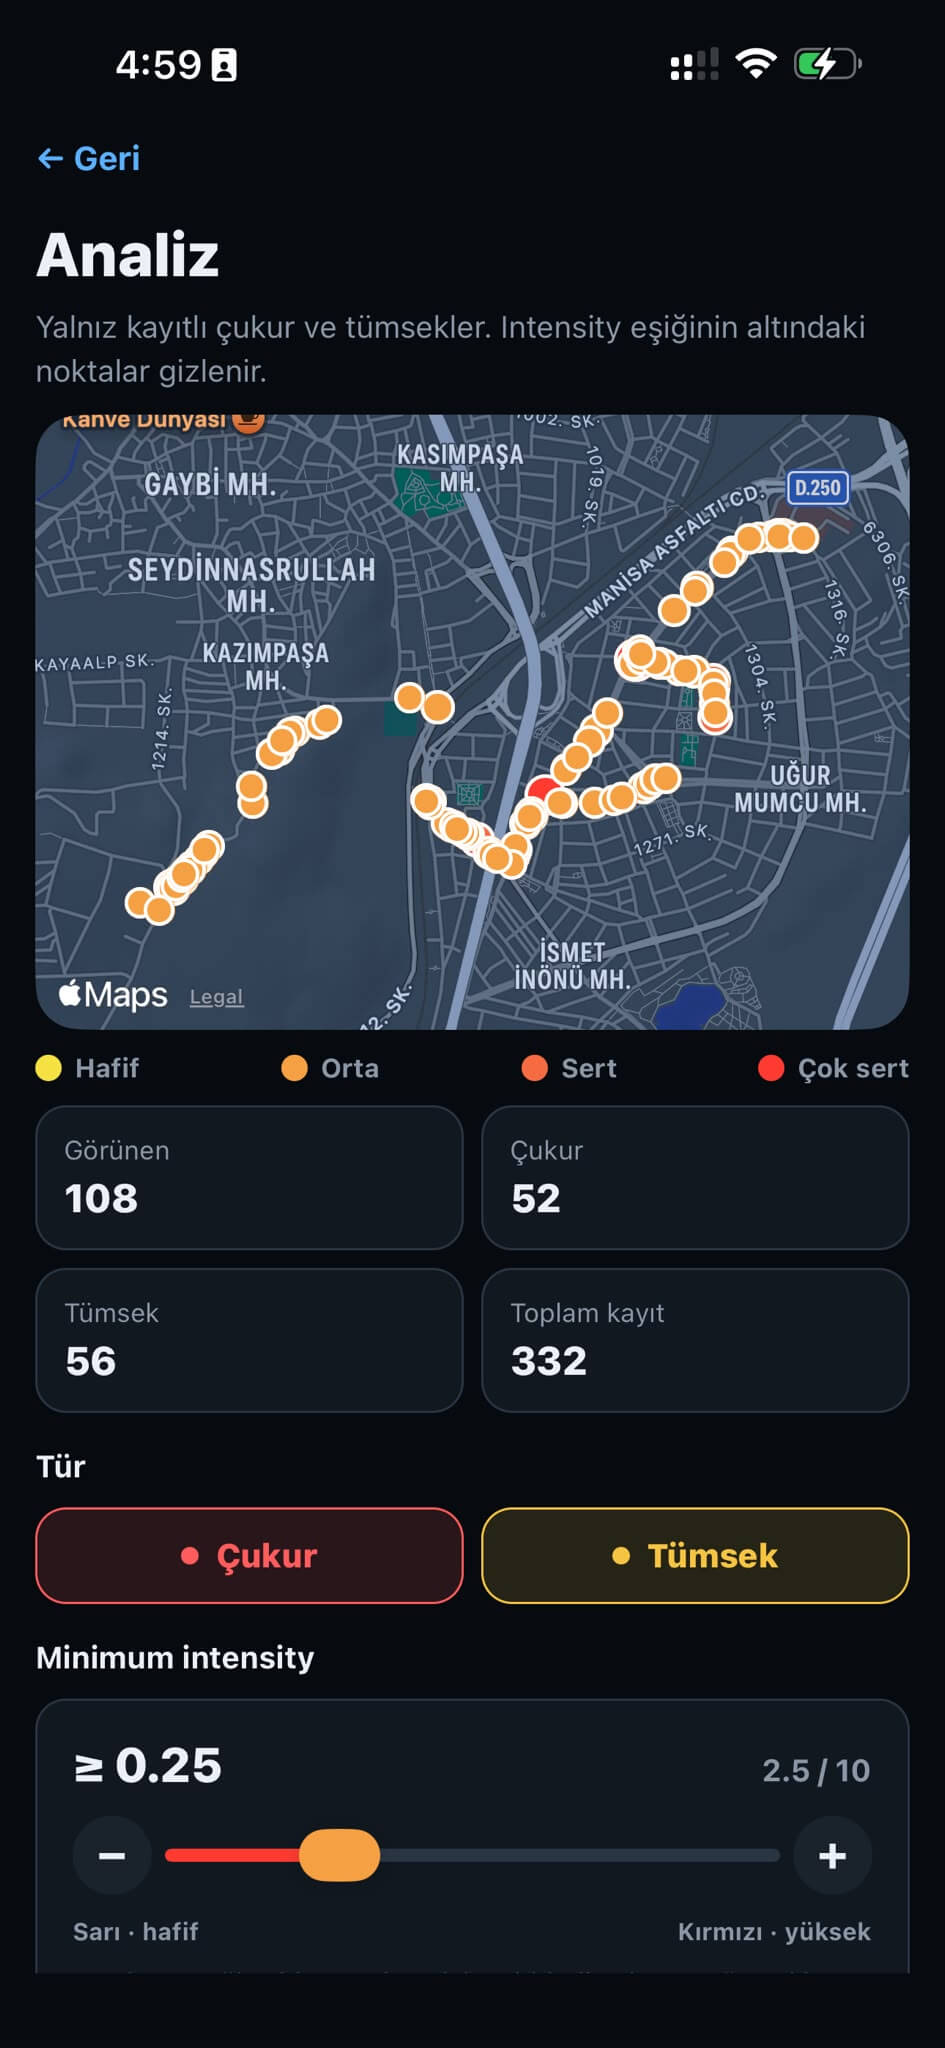 Computed road data shown to field personnel
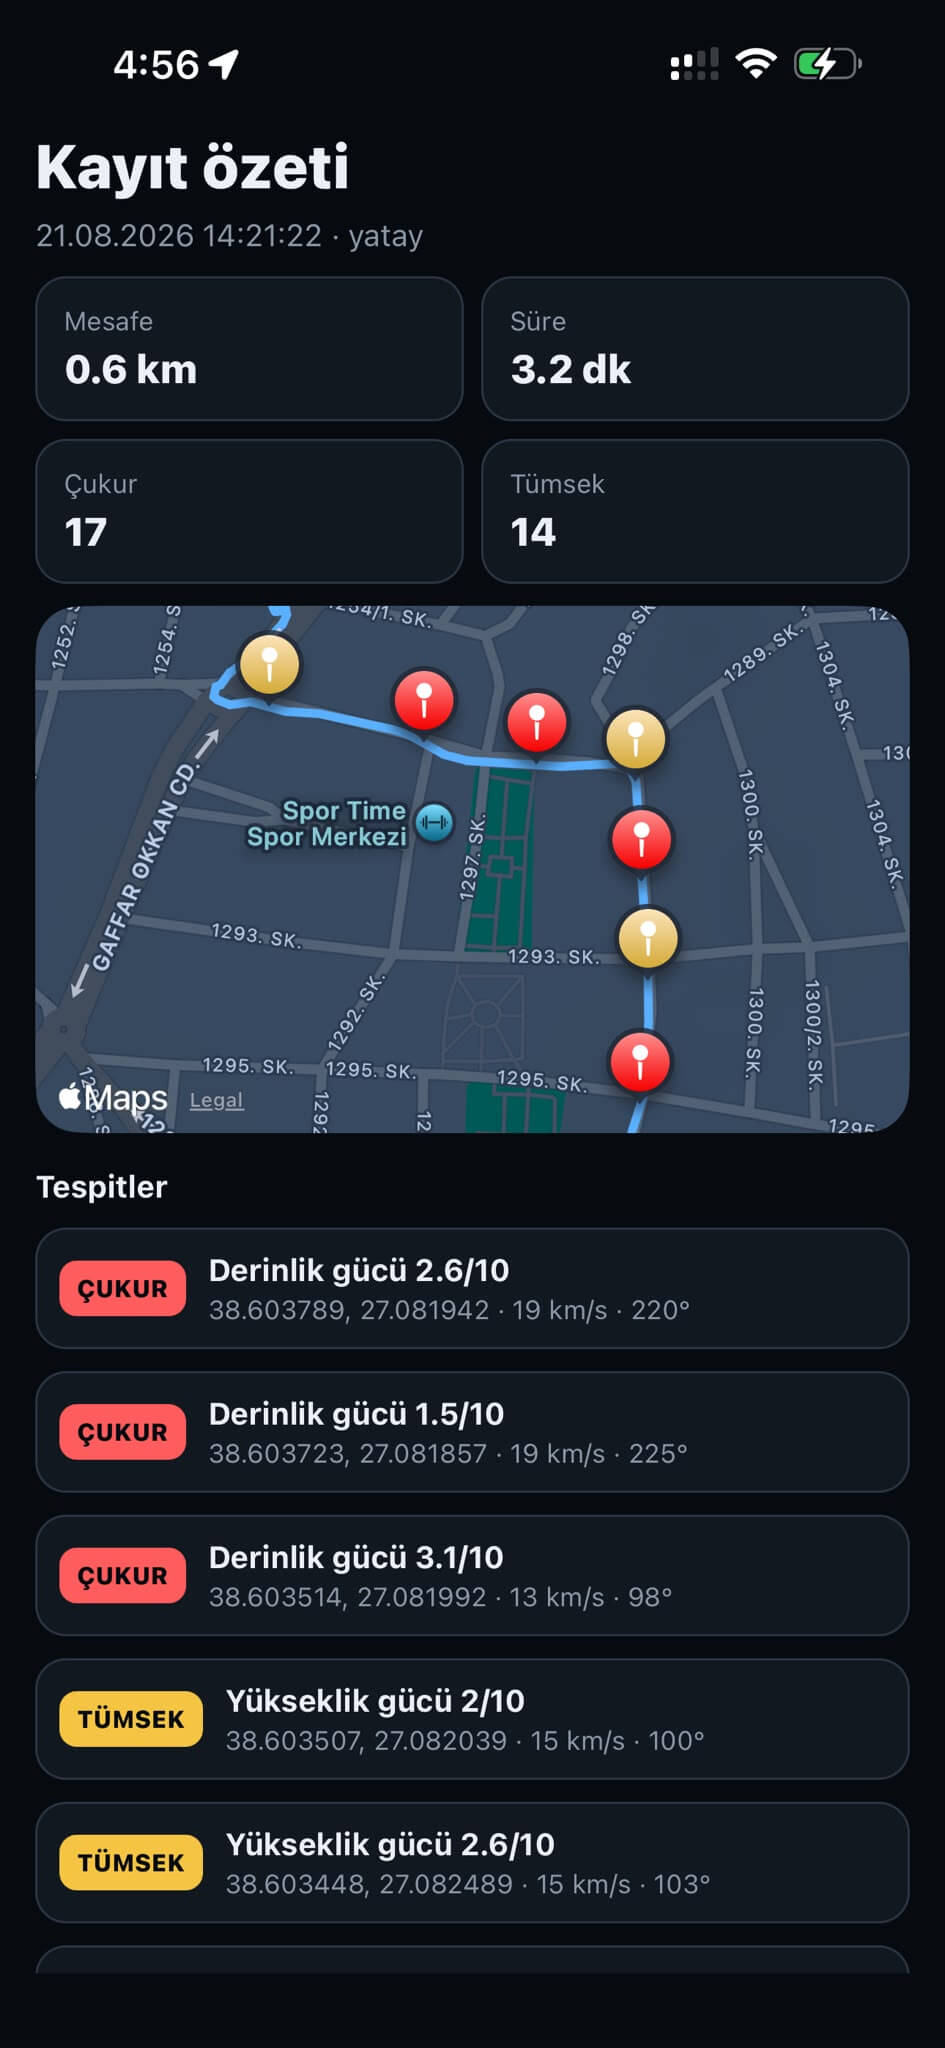 Detailed display of road issues
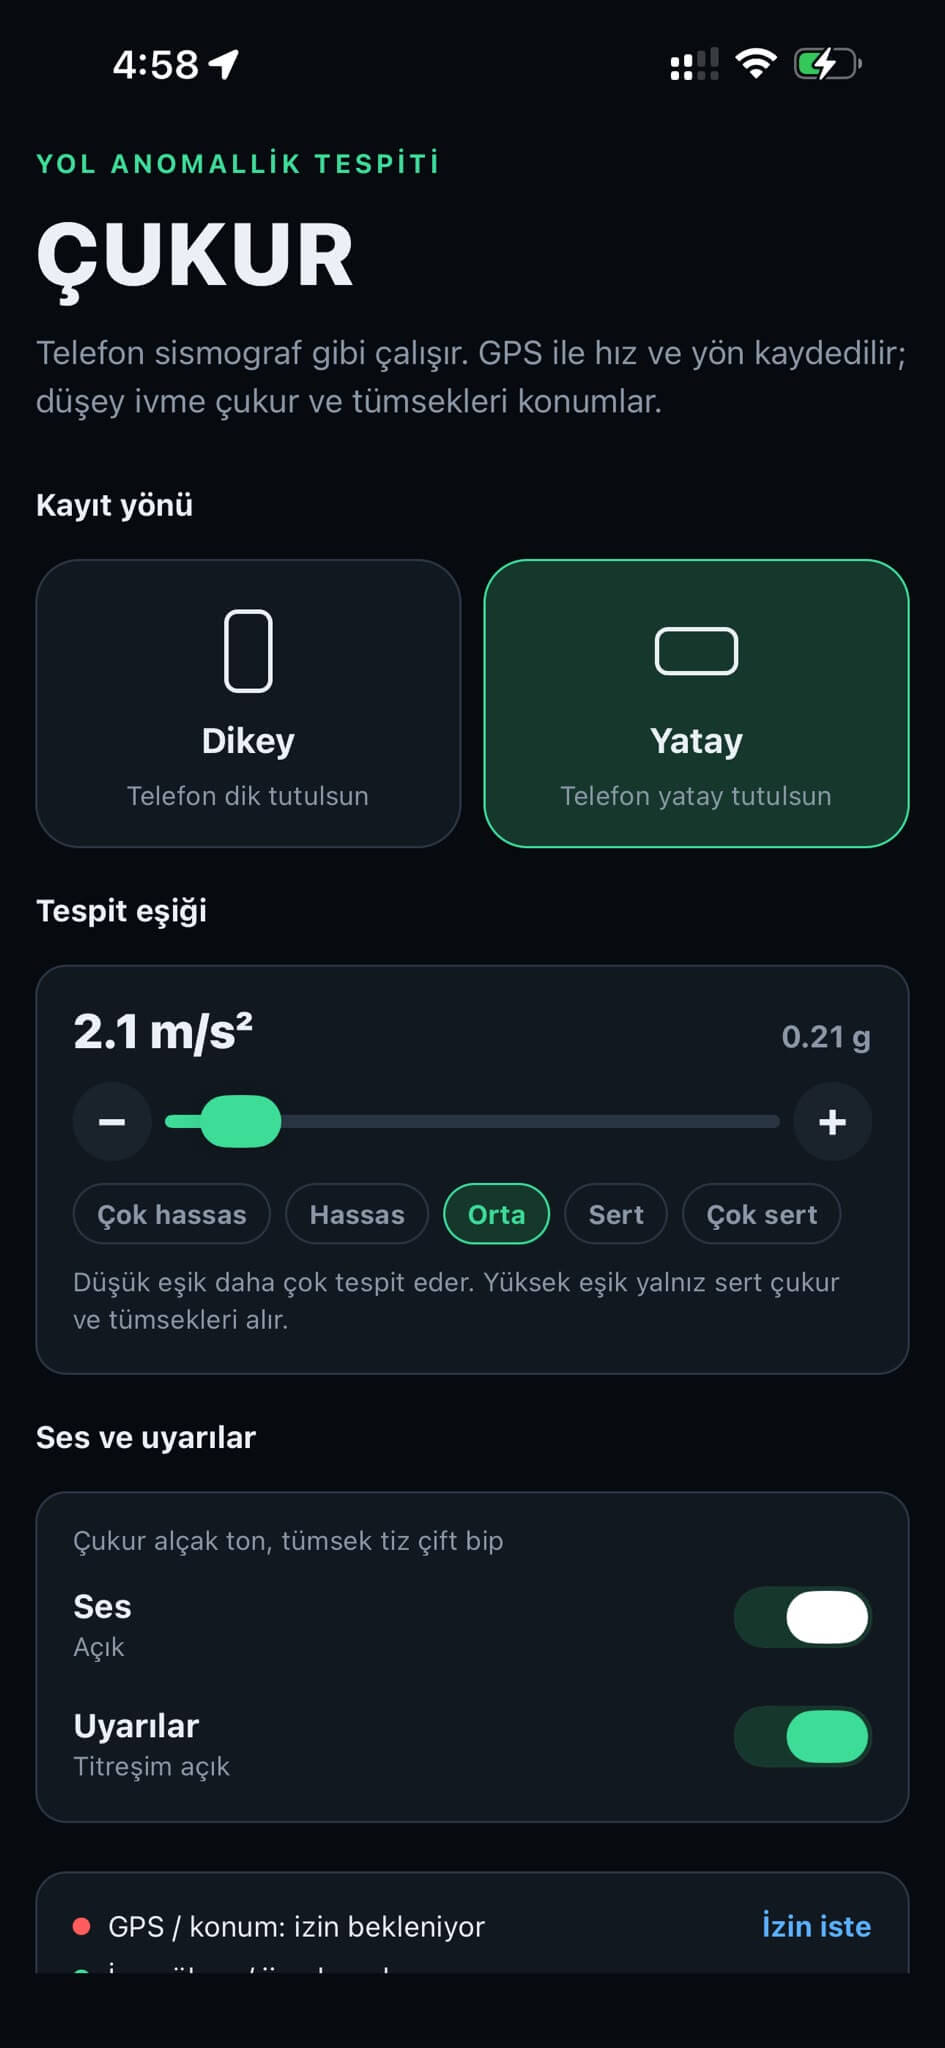 Threshold damage detection and audio alerts in the mobile app
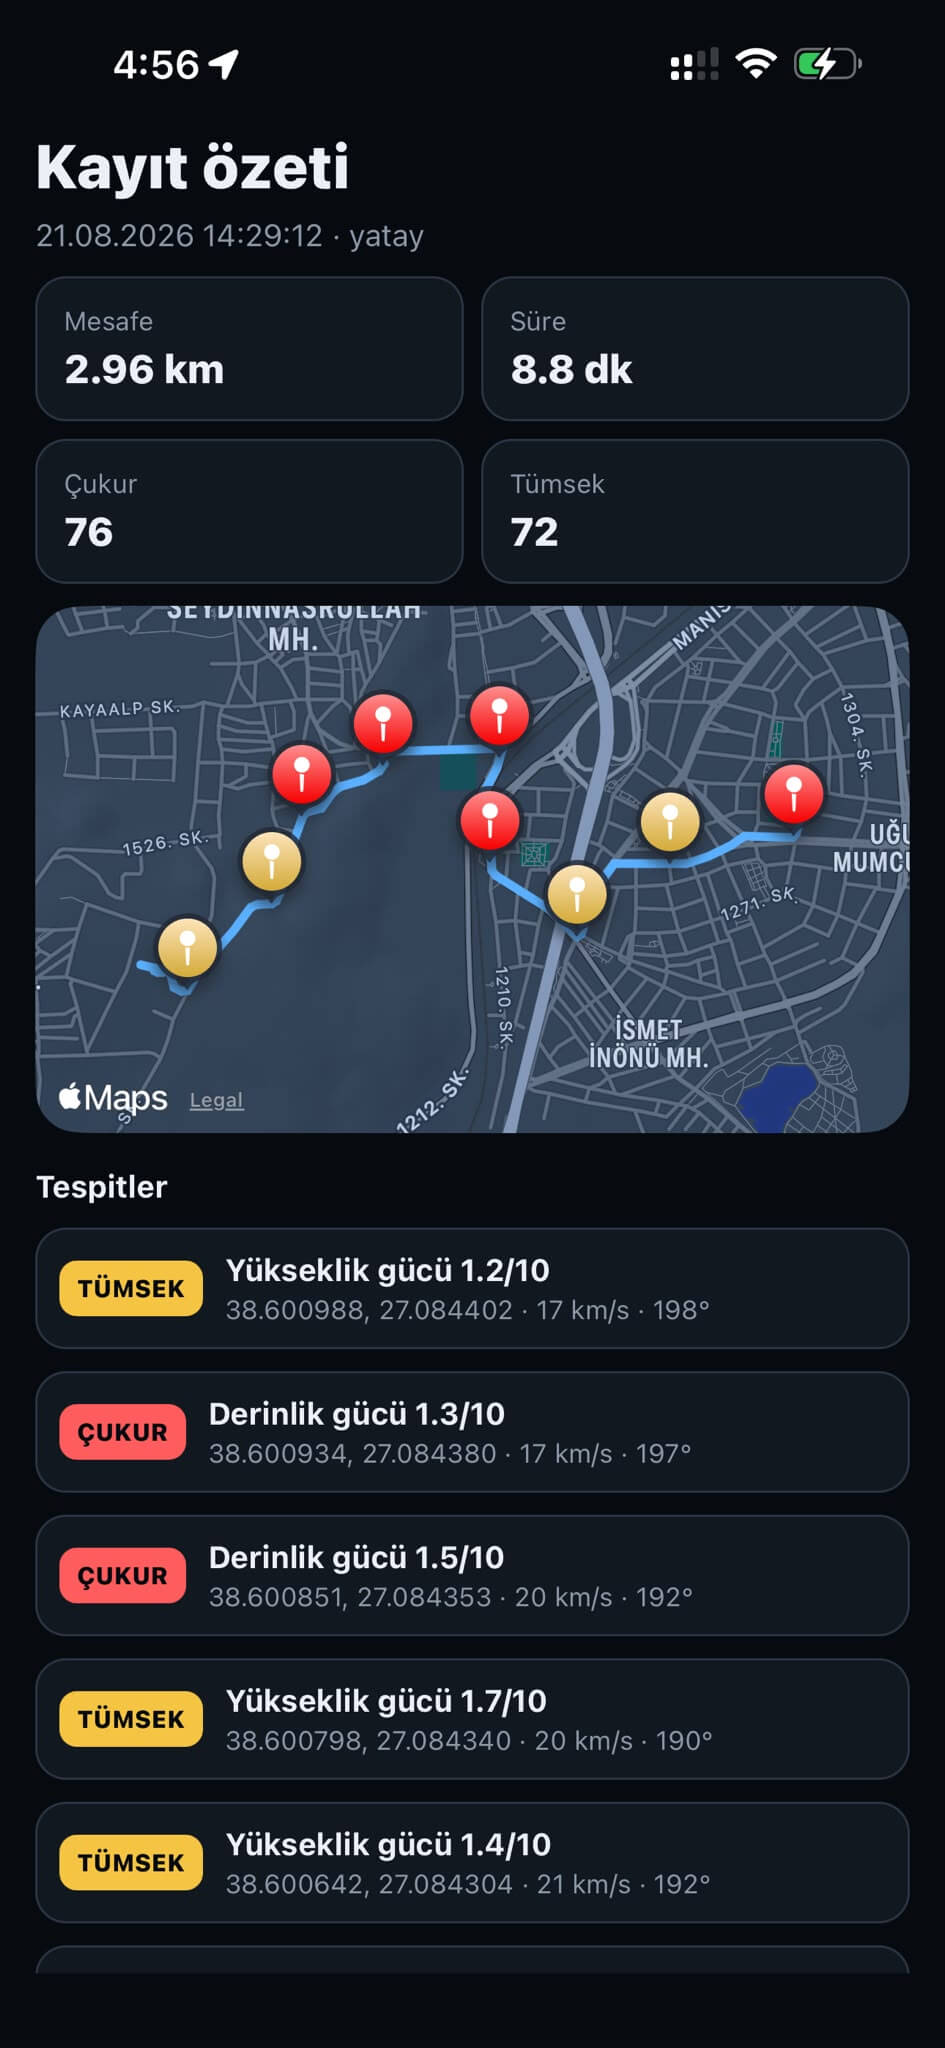 Sending completed routes to the system
Road-surface potholes, bumps, and similar defects can be detected with three main methods: street photos, 360° panoramic imagery, and when needed a laser scanner. Each method has its place; the right sequence lowers cost.
The first and cheapest step is panoramic imagery. Street-level 360° captures quickly scan the network’s overall condition and answer “where should we look?” at low cost. Suspicious points are marked and a priority list is built.
The second step is the mobile app. Using the phone’s location, accelerometer, and gyroscope, vehicle motion is measured in the field; potholes and bumps are recorded with location, severity, and route data. No expensive vehicle or dedicated sensor kit is required. Teams can measure the same day with existing phones.
The third step, when needed, is laser scanning. It is used on critical corridors that need high accuracy, cross-sections, and millimetre-level depth. Scanning an entire network with lasers is early and expensive for most agencies; focusing lasers on points filtered by panoramic survey and mobile measurement is more rational.
Çukur is built for the second step in the field: between cheap discovery and expensive scanning, a measurable, geolocated, and shareable production layer.
Çukur is an end-to-end workspace to detect, locate, filter by severity, and turn road potholes and bumps into deliverable institutional data. It is designed so municipal road maintenance, transport, GIS, and inspection teams answer “where is the defect, how severe, on which route?” in the same language.
The goal is simple: catch defects correctly in the field, see them on the map, filter by threshold, and when needed share safely as geospatial data and spreadsheets. Mount the phone in the vehicle, start recording, hear potholes and bumps instantly, and analyze the work in the office.
Overview and Expertise
Çukur is designed to meet the following core needs:
- Mobile field detection: The phone works like a vibration meter. Location, speed, heading, and route are recorded; vertical acceleration separates potholes from bumps.
- Pothole / bump classification: A downward first hit is a pothole; an upward first hit is a bump; depth and height intensity are stored.
- Adjustable detection threshold: Sensitive or strict; changeable during recording. Low threshold yields more points; high threshold keeps only severe defects.
- Instant feedback: Low tone for potholes, high double beep for bumps; sound and vibration can be muted separately.
- Geolocated records: Each point stores latitude, longitude, speed, heading, time, and severity.
- Geospatial delivery: Vehicle track as line, potholes–bumps as points; height in the third coordinate. Opens directly in GIS and browser analysis.
- History and import: Past geospatial surveys are added to the app; previous drives reopen on the map and in analysis.
- Analysis map: Only pothole and bump points; a severity slider hides values below the threshold; yellow (light) → red (very hard) scale.
- Type filter: Potholes and bumps toggle separately; with a selected recording only that route line and its points remain.
- Road profile: Selected recording height is drawn from the third coordinate; potholes mark below the curve, bumps above. A slider walks the route end to end.
- Multi-file (browser): Load multiple geospatial files; with no selection all points show, with selection one route and its own points.
- Export: Visible points download as spreadsheet and geospatial data; severity threshold and type filter apply to output.
- Dark / light map: Basemap switches for office or field presentation.
This structure turns road defects from verbal complaints or scattered photos into a continuously up-to-date, geolocated, and filterable work product.
Technology and Tools
The platform combines mobile field capture and browser analysis. Key components:
- Mobile app on Apple and Google stores
- Device accelerometer, gyroscope, and location for vertical acceleration and route logging
- Pothole–bump classification and severity scoring
- Open geospatial data (route line + defect points, height as third coordinate)
- Mobile analysis map and recording history
- Browser analysis: multi-file geospatial load, dark/light map, severity and type filters
- Road profile for the selected route and along-route navigation
- Spreadsheet and geospatial export
- Import of past surveys via document picker
It can extend to enterprise GIS, maintenance software, and open-data portals. It feeds panoramic discovery and laser validation layers; it does not have to replace them.
Process and Approach
A typical workflow:
- Cheap discovery (panoramic): Scan the network with 360° street imagery; mark suspicious corridors. Lowest-cost overview.
- Field measurement (mobile): On marked or routine routes, mount the phone; start Çukur recording. Potholes and bumps are announced instantly with sound and vibration and geolocated.
- Quality and threshold: Set detection threshold in the field or office; keep only points above the desired severity.
- Office analysis: Recordings and past geospatial files merge on the analysis map. Severity slider, type filter, and selected-route profile clarify priorities.
- Delivery: Filtered points go to maintenance, GIS, or tender files as geospatial data and spreadsheets.
- Laser when needed: On critical, conflicting, or high-cost sections, laser scanning is used. The mobile layer tells the scanner where to go; it does not force city-wide scanning.
Applications and Use Cases
The platform delivers value for:
- Municipal road maintenance and public works: Periodic drives for pothole–bump inventory; intervention order by severity.
- Transport and traffic units: Turning comfort and safety complaints into geolocated evidence.
- GIS teams: Adding lines and points to existing layers; sharing lists via spreadsheet.
- Asphalt and pavement contractors: Before/after route comparison; visible defect lists.
- Insurance, logistics, and fleets: Marking recurring damage corridors cheaply.
- Consulting and universities: Field campaigns, multi-recording merge, threshold sensitivity studies.
Customization and Flexibility
- Threshold and sensitivity: By institution or road type (asphalt / cobble / low speed).
- Alert preferences: Sound and vibration separate; mute for noisy field conditions.
- Recording orientation: Phone locked portrait or landscape; vertical axis computed relative to gravity.
- Analysis view: Severity range (light–medium–hard–very hard), type filter, dark/light map.
- Data output: Geospatial (map layer), spreadsheet (maintenance list); points above threshold.
- Workflow layer: Panoramic discovery first, then Çukur, laser if needed—in one work-order chain.
Support and Maintenance
To keep the solution reliable and current:
- Version and bug updates in a planned patch cycle.
- Field and office training so teams record and analyze from day one.
- When needed, second-level support, enterprise GIS connectivity, and customization channels.
Pricing Types
Institution-based proposals are recommended by user count, field-team scale, browser analysis / import–export scope, integration depth, and support level. Example packaging:
- Source Code Delivery: Code installed on institutional servers and devices under non-redistribution terms; data stays on premises.
- Software as a Service: Mobile and browser analysis hosted on Crocsoft infrastructure under an annual license.
Contact our sales team for detailed pricing.
Collaboration and Contact
In projects we aim for the right scope and realistic dates through:
- Regular status sharing and clear acceptance criteria (e.g. threshold, delivery format, route scope),
- Close work with institutional process owners (road maintenance, GIS, IT),
- Pre-release trial routes and field-team feedback.
Compliance and Standards
System design is grounded in:
- Open geospatial data suitable for map layers (line + point, height as third coordinate),
- Traceable records of location, time, severity, and type,
- Thresholds and filters reflected in output (reportable filtering),
- Layered method order with panoramic discovery and laser validation (cheap to expensive)
(final compliance reporting is produced per institutional requirements).
With Çukur, teams first scan the network with cheap panoramic overview, then measure in the field by phone, prioritize by severity, and only then use laser scanning when needed. Instead of “scanner everywhere,” you get a measurable, filterable, and shareable road-defect inventory.
What you gain at a glance
- Going to expensive scanning too early → First 360° panoramic discovery, then mobile measurement, laser if needed
- Saying “there’s a bad road” → Geolocated pothole–bump, severity, and route
- Taking notes one by one → Geospatial + spreadsheet, points above threshold
- Losing past work → Geospatial import and history
- Blind spots in the office → Analysis map, type filter, road profile, route walkthrough
- Team coordination → Same data, mobile field + browser analysis
The right sequence is produced more cheaply with the right tool. Contact us for your road-network inventory and maintenance priorities.


Don't hesitate to contact us
At our IT solution company, we are committed to exceptional service and support for your business needs.
Get in Touch