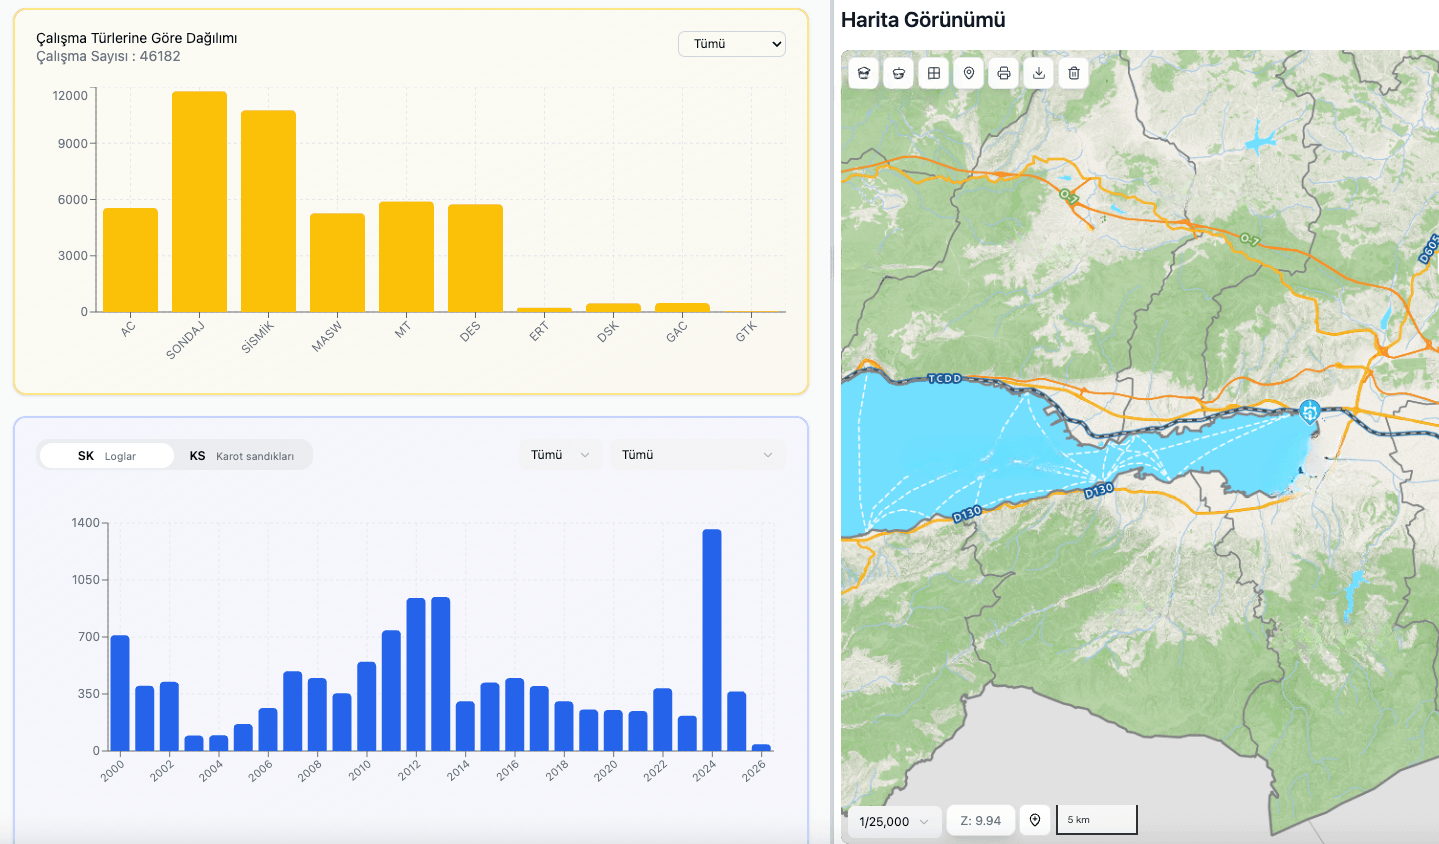
 Main dashboard and report summaries
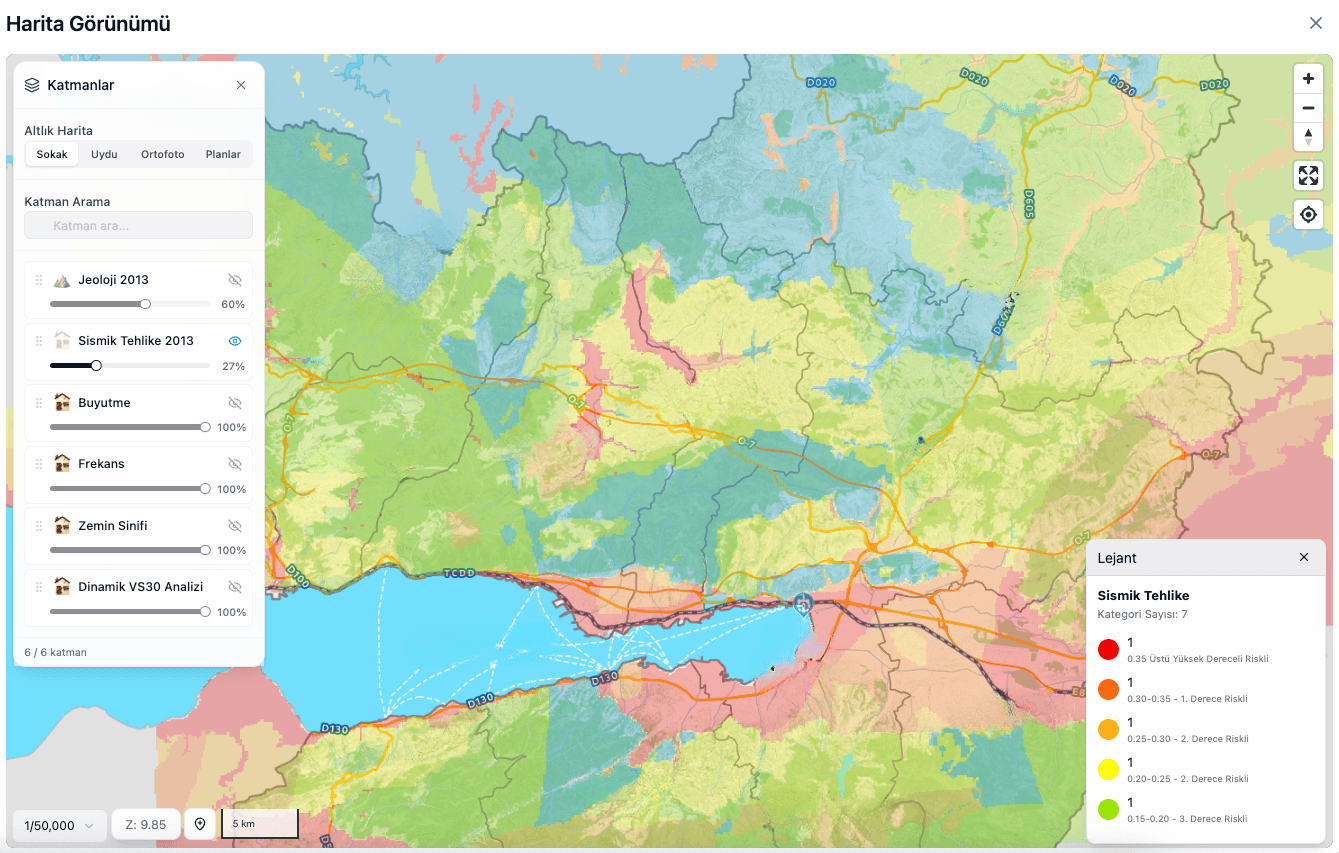 Mapping of analysis results
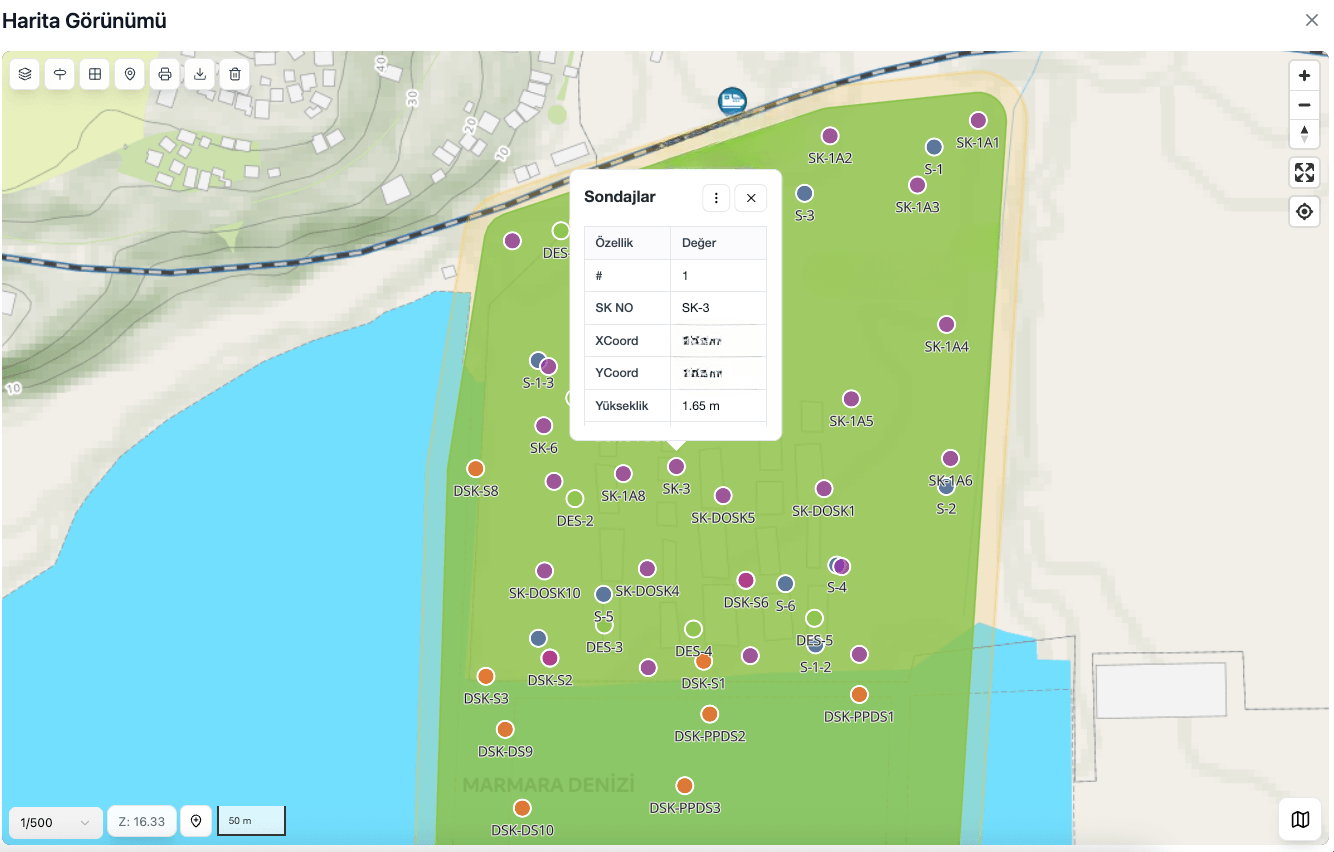 Detailed mapping of a ground investigation report
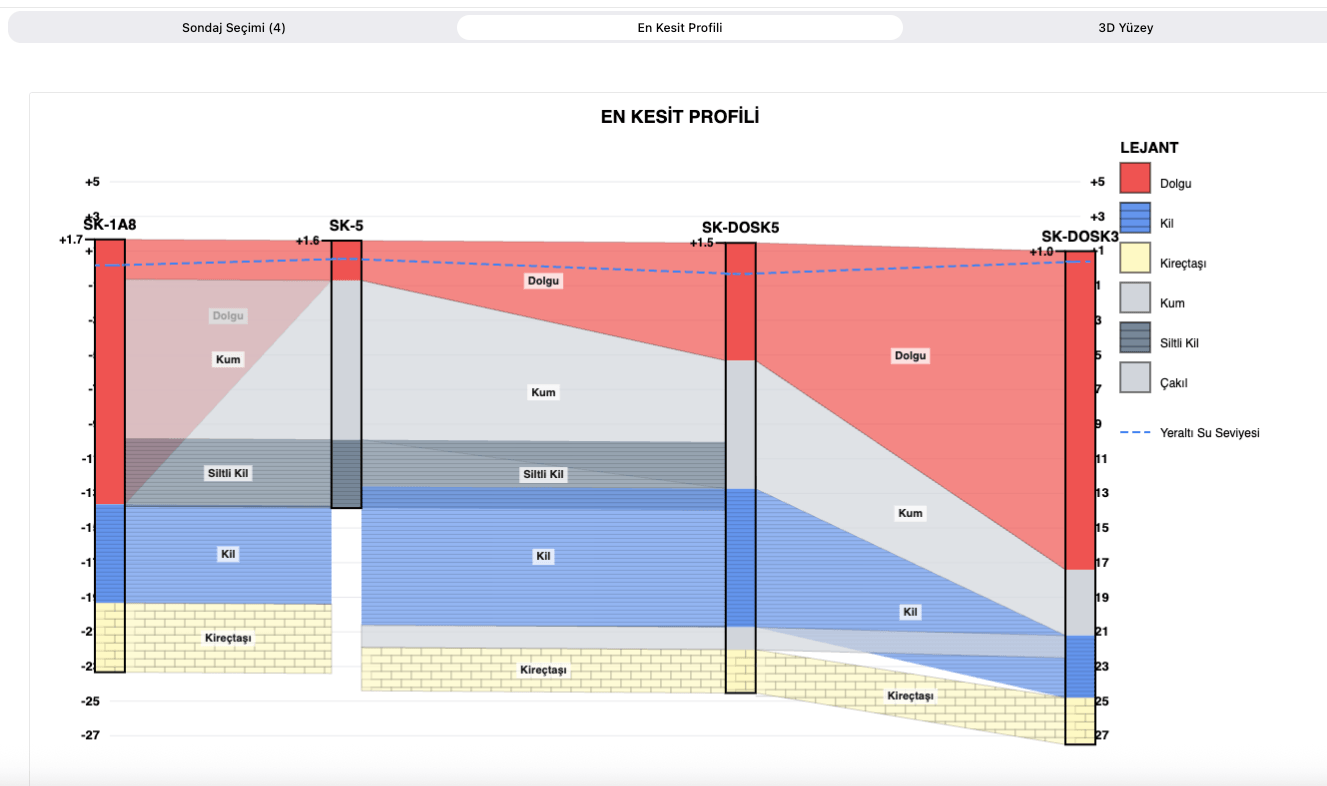 Dynamic cross-section profile generation
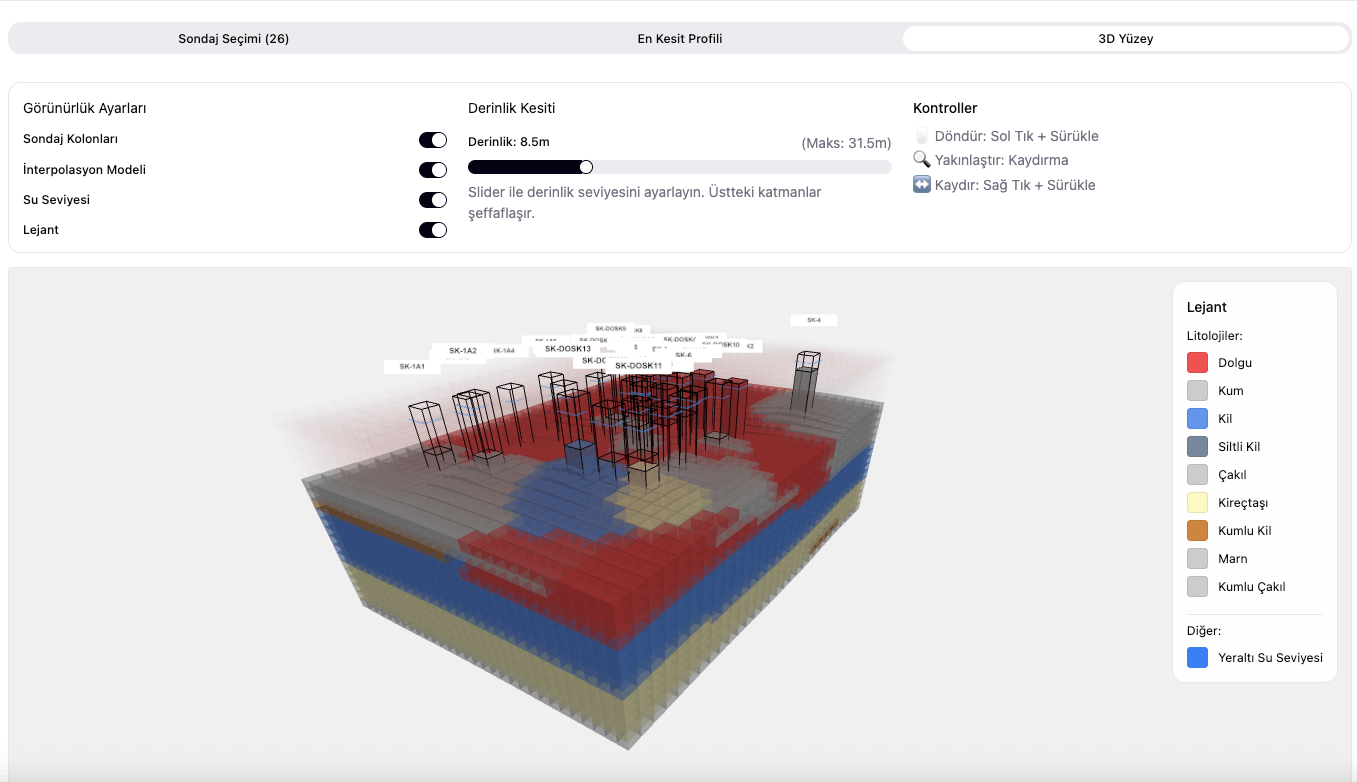 Dynamic 3D modeling of the subsurface
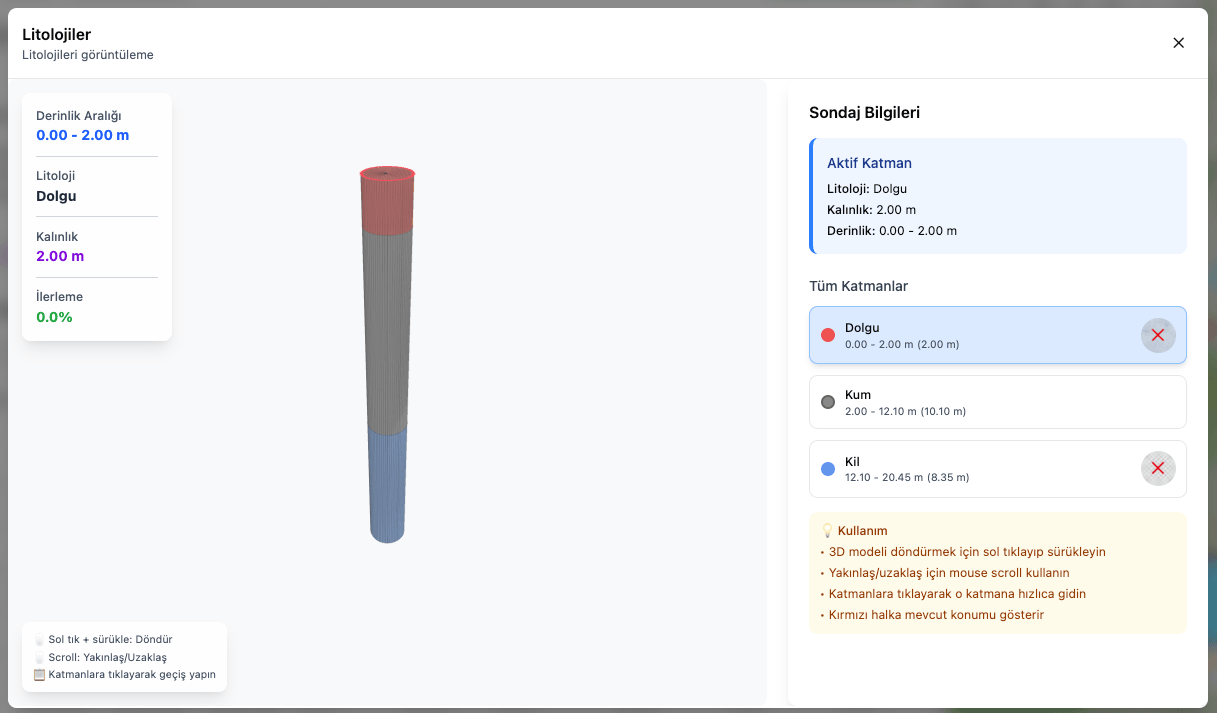 Drilling core modeling
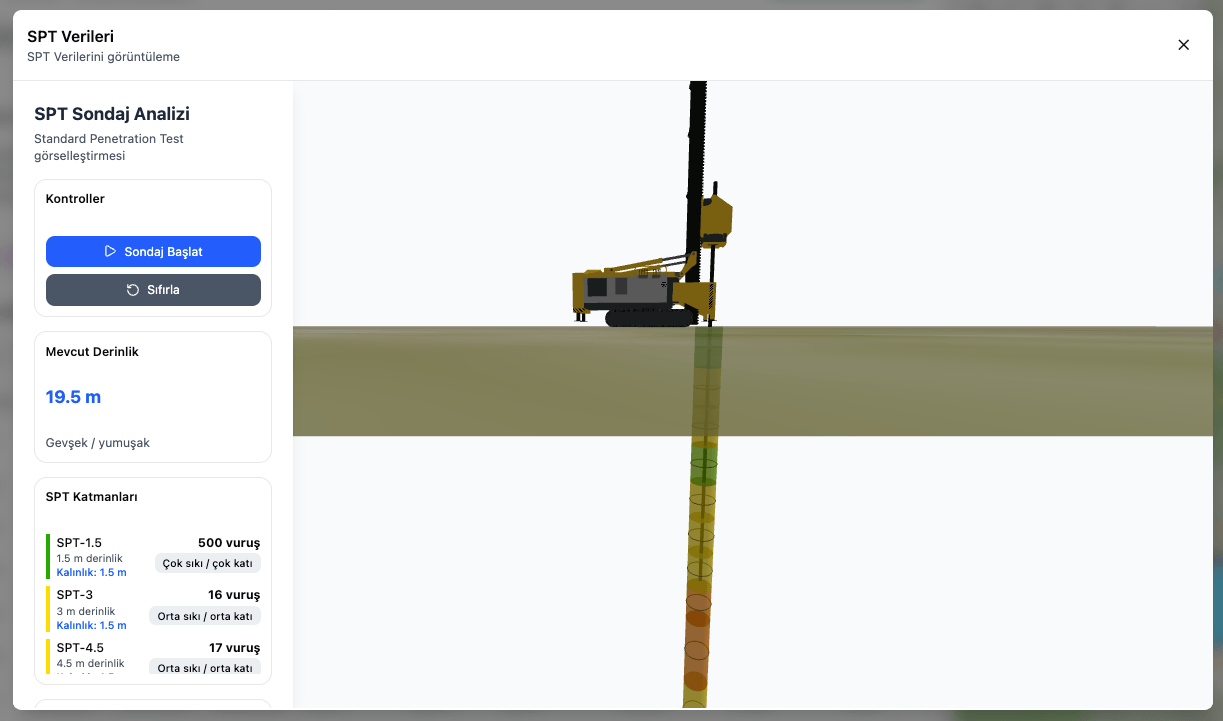 SPT procedure modeling and simulation
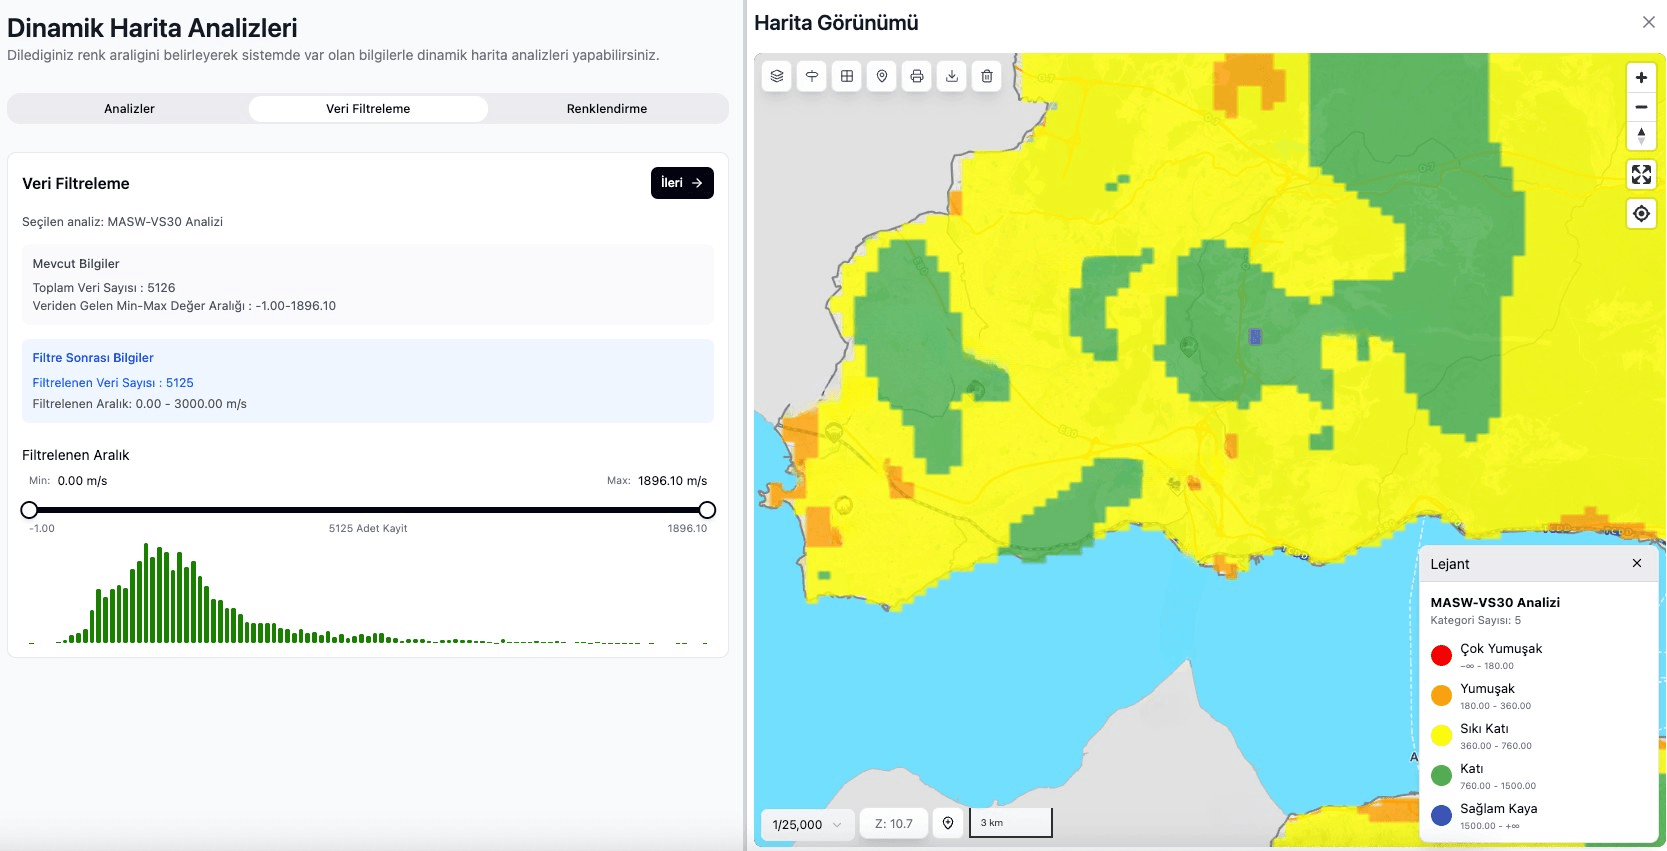 Dynamic map analyses
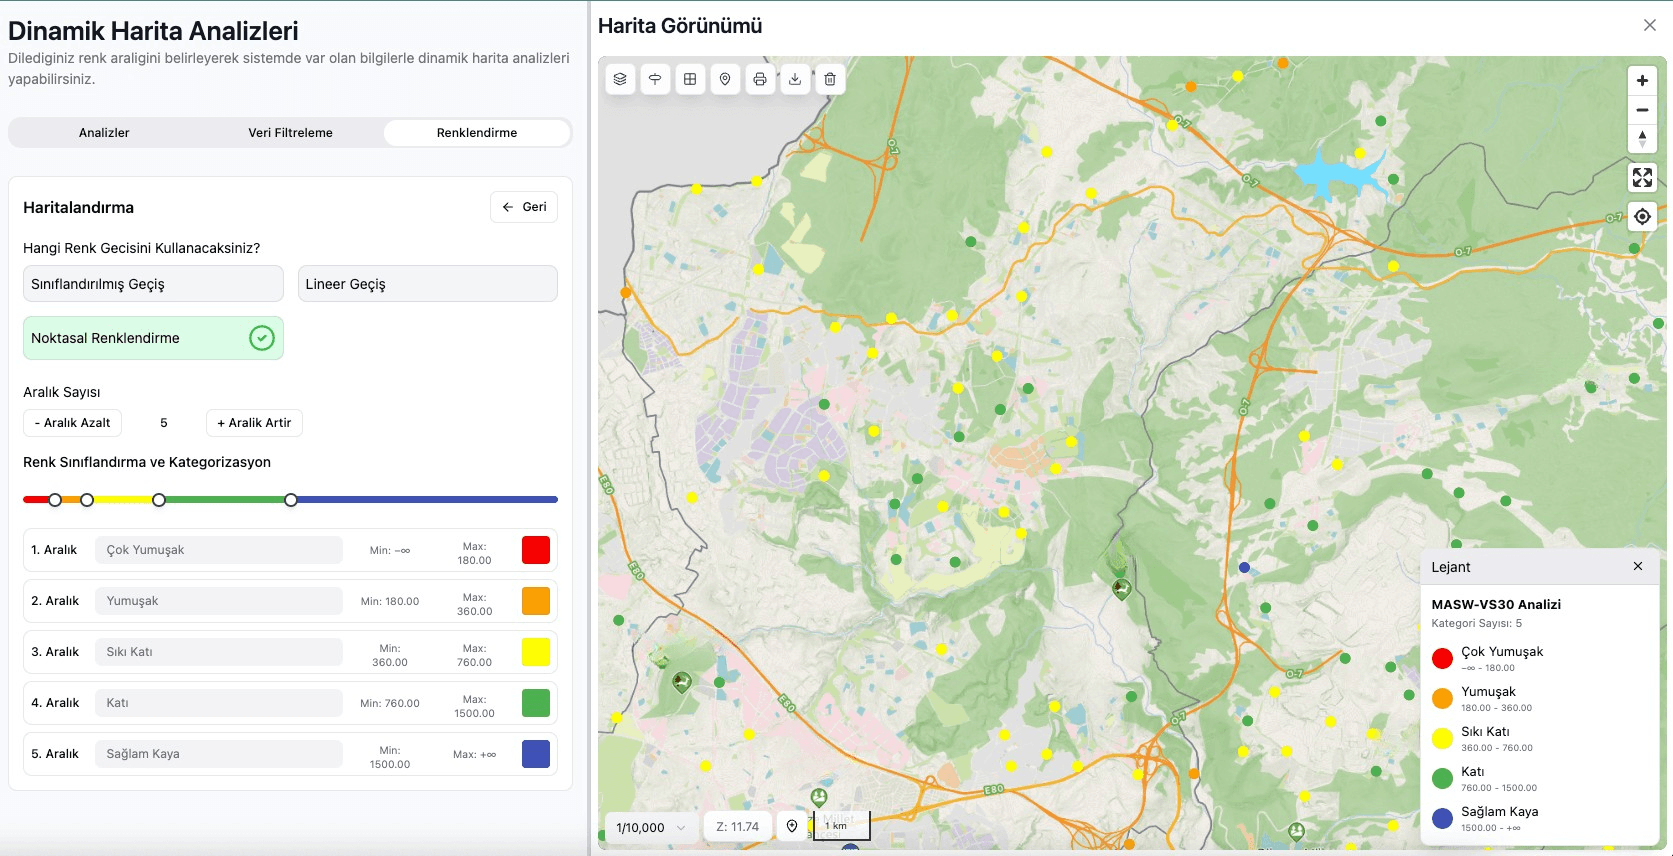 Thematic map analyses
Ground Data Bank Management Platform is a web-based enterprise management system that enables municipal and contractor teams to run the full lifecycle of ground investigation and geotechnical reports in a single environment. It brings together report creation and updates, recording of field studies (AC, drilling, seismic, MASW, MT, DES, ERT, DSK, GAC, etc.), map-based viewing and analysis, photo and video documentation, and role-based access. The goal is to replace scattered spreadsheets and files with a standard, traceable, and spatially rich data bank.
The platform is designed for metropolitan municipality, district municipality, and contractor roles. Each role can track relevant metrics, report statuses, and operational tasks on its own dashboard. Summary charts and filters stand out for managers; detailed record screens and map tools stand out for field and reporting teams.
Overview and Expertise
Ground Data Bank Management Platform is designed to meet the following core needs:
- Report and work management: Report cards, status workflows, file attachments, and tabular management of all sub-study types in report detail.
- Map-centric operations: Work areas, buffers, point/layer visualization; linking reports and field data to the map.
- Dynamic map analysis: Analysis templates, color scales (classified, linear, point-based), statistical surface modeling (kriging), and legend management.
- Visual documentation: Image and video upload tied to work areas, filtering, gallery navigation; map-located display and preview of images for a period selected from statistical charts.
- Enterprise administration: Users, roles, permissions, organizations, and dynamic data tables to extend the system to your institution.
- Research and reporting: Data-driven decision support through research screens, logs, and multiple views.
This structure allows planning, oversight, field data collection, and report approval processes to converge on the same data model.
Technology and Tools
The platform is built with a modern web stack; key components include:
- Type-safe, component-based UI with React and TypeScript
- Fast development and production builds with Vite
- Vector/map layers, popups, and interactive mapping with MapLibre GL
- Spatial calculations and geometry operations with Turf.js
- Area estimation / surface coloring flows based on kriging
- Dashboard and statistical charts with Recharts
- Map and session state management with Redux
- REST API integration (authentication, reports, files, and analysis endpoints)
Basemap layers, in-house services, and additional analysis endpoints can be added as needed.
Process and Approach
A typical usage flow can be summarized in these steps:
- Setup and authorization: Organizations, users, and the role/permission matrix are defined; menus and record screens are enabled per institutional policy.
- Report creation and updates: Report records are opened; work counts, files, and status information are kept in the system.
- Field data and tables: Data entry and updates in dynamic tables for sub-types such as AC, drilling, seismic, MASW, MT, DES, ERT, DSK, and GAC.
- Map and analysis: Work geometries are tracked on the map; template selection, filtering, and coloring are applied through the dynamic analysis module.
- Visual evidence and statistics: Field photo/video uploads are linked to reports; in the metropolitan view, year–month–district image count charts and map detail viewing can be used.
- Traceability: Transaction history is tracked through report logs and system logs.
Applications and Use Cases
The platform delivers value in scenarios such as:
- Metropolitan structure: Monitoring report density, user activity, and image statistics for all districts from a single central screen.
- District operations: Report and work tracking focused on local areas of responsibility.
- Ground investigation firms: Assigned reports, data upload, report delivery processes, and complete submission of field content.
- Technical units: Technical validation and presentation of reports with visualizations such as lithology, SPT, cross-sections, and depth profiles.
Customization and Flexibility
- Analysis templates and color sets: Templates and palettes can be defined per analysis type.
- Dynamic tables: Table structures and list views tailored to your organization can be created.
- Menu and permission design: Role-based menu and permission configuration.
- Map behavior: Layers, preview, buffer, and focus options adapt to your workflow.
Support and Maintenance
To keep the solution running and up to date:
- Version and bug updates are managed through a planned patch cycle.
- Configuration and training aim for rapid user adoption.
- When needed, second-level support and customization requests can be handled through technical contact channels.
Pricing Models
Institution-based quotes are recommended depending on user count, module scope (e.g. report management only or full analysis + map package), integration depth, and support SLA. Example package architecture:
- Source Code Delivery: All code is deployed on your server in a non-replicable, non-resalable form; data remains on your premises.
- Software as a Service: Data stays on Crocsoft servers with annual subscription licensing.
Contact our sales team for detailed pricing.
Collaboration and Communication
On projects we aim for the right scope and realistic delivery dates through:
- Regular status sharing and clear acceptance criteria,
- Close work with in-house process owners,
- Pilot user feedback before go-live.
Compliance and Standards
System design is based on:
- OGC alignment: Geometry exchange with GeoJSON and use of map services,
- Data model and reporting concepts aligned with geotechnical / ground investigation process language,
- KVKK / GDPR considerations: authentication and data access restricted by role.
(final compliance reporting is produced according to institutional requirements).
With Ground Data Bank Management Platform, institutions can centralize ground investigation data, enrich it with maps and analysis, and manage the report lifecycle transparently.
Contact us for enterprise transformation in ground data management.

Don't hesitate to contact us
At our IT solution company, we are committed to exceptional service and support for your business needs.
Get in Touch